Cities with the Most Accidents
Motor vehicle accidents are inevitable to some degree, but drivers in certain cities are particularly worse at avoiding them. These are the cities in every state with the highest at-fault accident rates in 2021.
Everyone makes mistakes. Rarely do drivers ever try to cause an accident, yet they still happen quite often. In fact, according to Insurify’s analysis, nearly 1 in 10 U.S. drivers report causing a motor vehicle accident in the prior seven years. Of course, just because motor vehicle crashes are common does not make them any less serious. Even if everyone involved is unharmed, an auto accident can still present a major headache for all parties involved. Insurance companies have to get involved to sort out property damage issues, and premiums will almost certainly go up for the at-fault driver. They may even rise for drivers not at fault, too.
So while traffic accidents are never wholly avoidable, drivers are wise to implement preventive measures on the road, such as practicing defensive driving and always being aware of one’s surroundings. Sometimes, however, driving safely can even mean being extra cautious when traveling through areas with particularly accident-prone motorists.
Accidents occur in every city, but certain places are home to drivers that cause accidents more frequently than the norml. To see which cities have the most accident-prone drivers, the data scientists at Insurify turned to their database of over 4 million car insurance applications to determine the city with the highest at-fault accident rate in every state in 2021.
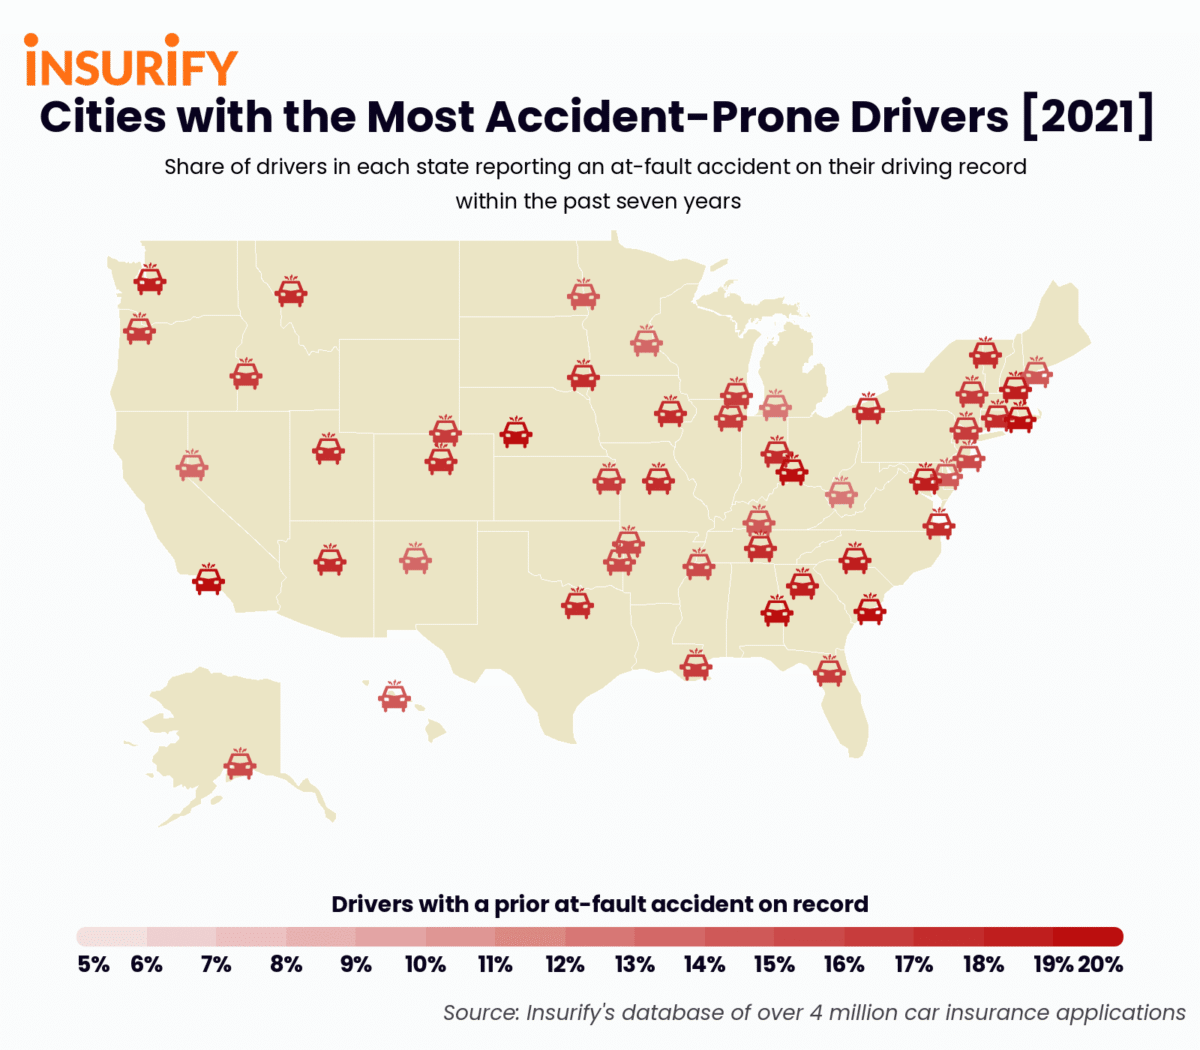
Insights
- National averages. On average, 9.98 percent of drivers across the U.S. have a prior at-fault accident on their driving record. 6.50 percent of drivers, meanwhile, have reported a no-fault accident in the past seven years.
- Be careful in California. If you’re ever taking a drive through southern California, beware. Simi Valley, a small city located about 40 miles from downtown Los Angeles, has the highest at-fault accident rate of any city in the country. A full 16.84 percent of drivers there have an at-fault accident on record, making Simi Valley motorists nearly 1.7 times more accident prone than the average driver. Huntington Beach and Norwalk, two cities that also lie in the greater Los Angeles area, have the second and third most accident-prone drivers in California, with accident rates that are 49 and 44 percent higher, respectively, than the national average.
- The most frustrated drivers in the country. Causing an accident is always upsetting, but it can be even more frustrating for drivers that do nothing wrong yet still end up involved in a crash.. Drivers in Milwaukee, Wisconsin are no stranger to getting dragged into accidents they did not cause, as the city has the highest no-fault accident rate in the country. 12.05 percent of Milwaukee drivers report a no-fault accident on record, a rate almost 1.9 times greater than the national average.
Methodology
The data scientists at Insurify, a website to compare auto insurance rates, referred to their database of over 4 million car insurance applications to identify the city in every state with the most accident-prone drivers.
When applying for car insurance, applicants disclose their city and state of residence, as well as any prior violations on their driving record within the past seven years, including at-fault and no-fault accidents. At-fault accident laws vary slightly by state, but an at-fault driver is generally at least 50 percent responsible for a given traffic crash. A no-fault driver is less than 50 percent responsible for the accident in which they are involved.
To determine the city with the highest at-fault accident rate in every state, Insurify’s data scientists calculated the share of drivers reporting an at-fault accident on their driving record in 590 separate U.S. cities over the past seven years. The city with the highest share of these drivers in each state was identified as the city with the most accident-prone drivers in that respective state.
The Insurify data science team considered all U.S. cities with a population greater than 50,000 and with sufficient driving application data. For states with one or zero cities of greater than 50,000 people, the next largest city or cities with sufficient driving application data were considered.

Top 5 Cities with the Most Accident-Prone Drivers
1. Simi Valley, CA - 16.84% of drivers reporting an at-fault accident on record
2. Fall River, MA - 16.24% of drivers reporting an at-fault accident on record
3. Lincoln, NE - 16.22% of drivers reporting an at-fault accident on record
4. Auburn, AL - 16.04% of drivers reporting an at-fault accident on record
5. Charleston, SC - 15.76% of drivers reporting an at-fault accident on record
The Cities with the Most At-Fault Accidents, 2021
Alabama: Auburn
- Percentage of drivers with a prior at-fault accident: 16.04% (1.46 times greater than state average)
- Percentage of drivers with a prior no-fault accident: 7.46%
Alaska: Anchorage
- Percentage of drivers with a prior at-fault accident: 11.09% (1.02 times greater than state average)
- Percentage of drivers with a prior no-fault accident: 8.19%
Arizona: Flagstaff
- Percentage of drivers with a prior at-fault accident: 13.95% (1.41 times greater than state average)
- Percentage of drivers with a prior no-fault accident: 6.36%
Arkansas: Fayetteville
- Percentage of drivers with a prior at-fault accident: 11.65% (1.30 times greater than state average)
- Percentage of drivers with a prior no-fault accident: 4.55%
California: Simi Valley
- Percentage of drivers with a prior at-fault accident: 16.84% (1.53 times greater than state average)
- Percentage of drivers with a prior no-fault accident: 4.81%
Colorado: Arvada
- Percentage of drivers with a prior at-fault accident: 13.90% (1.28 times greater than state average)
- Percentage of drivers with a prior no-fault accident: 7.72%
Connecticut: Manchester
- Percentage of drivers with a prior at-fault accident: 13.02% (1.39 times greater than state average)
- Percentage of drivers with a prior no-fault accident: 8.68%
Delaware: Dover
- Percentage of drivers with a prior at-fault accident: 9.97% (1.08 times greater than state average)
- Percentage of drivers with a prior no-fault accident: 7.57%
Florida: Gainesville
- Percentage of drivers with a prior at-fault accident: 12.42% (1.35 times greater than state average)
- Percentage of drivers with a prior no-fault accident: 8.15%
Georgia: Dacula
- Percentage of drivers with a prior at-fault accident: 14.37% (1.25 times greater than state average)
- Percentage of drivers with a prior no-fault accident: 4.74%
Hawaii: Honolulu
- Percentage of drivers with a prior at-fault accident: 9.55% (1.05 times greater than state average)
- Percentage of drivers with a prior no-fault accident: 7.03%
Idaho: Nampa
- Percentage of drivers with a prior at-fault accident: 12.86% (1.11 times greater than state average)
- Percentage of drivers with a prior no-fault accident: 6.38%
Illinois: Naperville
- Percentage of drivers with a prior at-fault accident: 11.82% (1.54 times greater than state average)
- Percentage of drivers with a prior no-fault accident: 5.16%
Indiana: Muncie
- Percentage of drivers with a prior at-fault accident: 13.12% (1.20 times greater than state average)
- Percentage of drivers with a prior no-fault accident: 8.18%
Iowa: Cedar Rapids
- Percentage of drivers with a prior at-fault accident: 12.94% (1.11 times greater than state average)
- Percentage of drivers with a prior no-fault accident: 7.73%
Kansas: Lawrence
- Percentage of drivers with a prior at-fault accident: 11.89% (1.12 times greater than state average)
- Percentage of drivers with a prior no-fault accident: 5.50%
Kentucky: Bowling Green
- Percentage of drivers with a prior at-fault accident: 10.46% (1.12 times greater than state average)
- Percentage of drivers with a prior no-fault accident: 6.46%
Louisiana: Metairie
- Percentage of drivers with a prior at-fault accident: 11.79% (1.24 times greater than state average)
- Percentage of drivers with a prior no-fault accident: 6.00%
Maine: Portland
- Percentage of drivers with a prior at-fault accident: 10.36% (1.04 times greater than state average)
- Percentage of drivers with a prior no-fault accident: 8.29%
Maryland: Bowie
- Percentage of drivers with a prior at-fault accident: 14.23% (1.13 times greater than state average)
- Percentage of drivers with a prior no-fault accident: 7.73%
Massachusetts: Fall River
- Percentage of drivers with a prior at-fault accident: 16.24% (1.29 times greater than state average)
- Percentage of drivers with a prior no-fault accident: 7.65%
Michigan: Kalamazoo
- Percentage of drivers with a prior at-fault accident: 7.54% (1.54 times greater than state average)
- Percentage of drivers with a prior no-fault accident: 3.34%
Minnesota: St. Paul
- Percentage of drivers with a prior at-fault accident: 8.86% (1.02 times greater than state average)
- Percentage of drivers with a prior no-fault accident: 7.36%
Mississippi: Southaven
- Percentage of drivers with a prior at-fault accident: 11.27% (1.58 times greater than state average)
- Percentage of drivers with a prior no-fault accident: 9.21%
Missouri: Columbia
- Percentage of drivers with a prior at-fault accident: 12.99% (1.32 times greater than state average)
- Percentage of drivers with a prior no-fault accident: 6.50%
Montana: Missoula
- Percentage of drivers with a prior at-fault accident: 13.72% (1.26 times greater than state average)
- Percentage of drivers with a prior no-fault accident: 4.46%
Nebraska: Lincoln
- Percentage of drivers with a prior at-fault accident: 16.22% (1.12 times greater than state average)
- Percentage of drivers with a prior no-fault accident: 8.31%
Nevada: Sparks
- Percentage of drivers with a prior at-fault accident: 9.27% (1.30 times greater than state average)
- Percentage of drivers with a prior no-fault accident: 3.20%
New Hampshire: Manchester
- Percentage of drivers with a prior at-fault accident: 14.36% (1.03 times greater than state average)
- Percentage of drivers with a prior no-fault accident: 7.94%
New Mexico: Rio Rancho
- Percentage of drivers with a prior at-fault accident: 9.49% (1.40 times greater than state average)
- Percentage of drivers with a prior no-fault accident: 7.06%
New Jersey: Toms River
- Percentage of drivers with a prior at-fault accident: 11.08% (1.10 times greater than state average)
- Percentage of drivers with a prior no-fault accident: 8.99%
New York: Schenectady
- Percentage of drivers with a prior at-fault accident: 12.62% (1.84 times greater than state average)
- Percentage of drivers with a prior no-fault accident: 7.17%
North Carolina: Charlotte
- Percentage of drivers with a prior at-fault accident: 14.59% (1.20 times greater than state average)
- Percentage of drivers with a prior no-fault accident: 8.14%
North Dakota: Fargo
- Percentage of drivers with a prior at-fault accident: 10.57% (1.12 times greater than state average)
- Percentage of drivers with a prior no-fault accident: 6.41%
Ohio: Hamilton
- Percentage of drivers with a prior at-fault accident: 15.21% (1.15 times greater than state average)
- Percentage of drivers with a prior no-fault accident: 8.17%
Oklahoma: Edmund
- Percentage of drivers with a prior at-fault accident: 11.52% (1.29 times greater than state average)
- Percentage of drivers with a prior no-fault accident: 5.41%
Oregon: Beaverton
- Percentage of drivers with a prior at-fault accident: 12.61% (1.10 times greater than state average)
- Percentage of drivers with a prior no-fault accident: 7.12%
Pennsylvania: Erie
- Percentage of drivers with a prior at-fault accident: 13.38% (1.37 times greater than state average)
- Percentage of drivers with a prior no-fault accident: 7.23%
Rhode Island: Warwick
- Percentage of drivers with a prior at-fault accident: 12.90% (1.17 times greater than state average)
- Percentage of drivers with a prior no-fault accident: 7.44%
South Carolina: Charleston
- Percentage of drivers with a prior at-fault accident: 15.76% (1.06 times greater than state average)
- Percentage of drivers with a prior no-fault accident: 8.61%
South Dakota: Sioux Falls
- Percentage of drivers with a prior at-fault accident: 13.11% (1.07 times greater than state average)
- Percentage of drivers with a prior no-fault accident: 5.95%
Tennessee: Murfreesboro
- Percentage of drivers with a prior at-fault accident: 13.07% (1.19 times greater than state average)
- Percentage of drivers with a prior no-fault accident: 10.45%
Texas: Flower Mound
- Percentage of drivers with a prior at-fault accident: 13.18% (1.44 times greater than state average)
- Percentage of drivers with a prior no-fault accident: 6.10%
Utah: Orem
- Percentage of drivers with a prior at-fault accident: 13.60% (1.16 times greater than state average)
- Percentage of drivers with a prior no-fault accident: 5.19%
Vermont: Burlington
- Percentage of drivers with a prior at-fault accident: 13.39% (1.08 times greater than state average)
- Percentage of drivers with a prior no-fault accident: 8.66%
Virginia: Virginia Beach
- Percentage of drivers with a prior at-fault accident: 13.15% (1.12 times greater than state average)
- Percentage of drivers with a prior no-fault accident: 7.58%
Washington: Renton
- Percentage of drivers with a prior at-fault accident: 14.16% (1.24 times greater than state average)
- Percentage of drivers with a prior no-fault accident: 7.99%
West Virginia: Charleston
- Percentage of drivers with a prior at-fault accident: 8.30% (1.13 times greater than state average)
- Percentage of drivers with a prior no-fault accident: 6.08%
Wisconsin: Racine
- Percentage of drivers with a prior at-fault accident: 11.89% (1.23 times greater than state average)
- Percentage of drivers with a prior no-fault accident: 8.95%
Wyoming: Cheyenne
- Percentage of drivers with a prior at-fault accident: 12.43% (1.04 times greater than state average)
- Percentage of drivers with a prior no-fault accident: 6.71%
If you have any questions or comments about this article or would like to request the data, please contact insights@insurify.com.
More From KOOC-FM